













Россия
Волгоград, Россия
Сепарация твердых частиц от газового потока в циклонных устройствах регулируется сложными турбулентными потоками внутри рабочей камеры, поэтому точность моделирования динамики газа является ключевым фактором в прогнозировании эффективности очистки входного потока. В исследовании использован метод крупных вихрей (LES) в рамках ANSYS Fluent. Полученные результаты сравниваются с моделью напряжений Рейнольдса (RSM), которая является наиболее точной и широко используемой анизотропной моделью турбулентности для моделирования циклонов на основе RANS. Для проведения более детального анализа временной структуры возмущений в пристеночной области предложено использовать приращения скорости или вычислять локальное ускорение потока. Такой подход позволяет идентифицировать мелкомасштабную динамику быстрых возмущений, которые обычно скрываются при использовании традиционных методов усреднения по времени. Вычислительные эксперименты с использованием модели LES выявляют наличие мелкомасштабных вытянутых структур, известных как пристеночные полосы. Эти структуры движутся вдоль твердых поверхностей в пристеночной области циклона. Подобные полосатые структуры образуются внутри пограничного слоя. Предложенный метод на основе локальных ускорений позволяет детально исследовать процессы подсеточного масштаба в рамках LES-моделирования. Локальные ускорения, связанные с этими полосатыми возмущениями, могут достигать величины 100 g. Это может негативно повлиять на эффек-тивность разделения и усилить абразивный износ стенок. Приведены оценки фазовой скорости и времени жизни этих нелинейных возмущений вблизи стенки. Эти оценки согласуются с результатами прямого численного моделирования (DNS) для генерации вихревых структур в пограничных слоях. Турбулентная модель RSM, напротив, не позволяет разрешить эти полосатые структуры при анализе локальных полей ускорения.
циклонный сепаратор, турбулентный поток газа, вычислительная гидродинамика, метод крупных вихрей
Introduction
The history of using apparatuses with rotating gas for solid particle separation spans more than 100 years [1–3]. It is possible to distinguish axial-flow cyclones [4], apparatuses with tangential gas inlets [5], counterswirling flow cyclones [6, 7], multicyclones [8], and other types. A vast number of diverse designs have been proposed to address specific technological challenges [9–11]. A patent review [12] demonstrates a wide range of technical solutions aimed at reducing the negative impact of atmospheric emissions. Special requirements are imposed on apparatuses used in powder printing [13], the construction industry [14], the agricultural sector [15], mechanical engineering [16], and other industries. The use of separators in the chemical industry is a separate challenge [17, 18]. In this field, they act as integral parts of the technological process, enabling the recovery of catalysts or other valuable components.
Numerical simulation of gas-dynamic processes inside cyclone separators has become the primary research tool, as traditional empirical models do not account for the true complexity of vortex flows [2, 11, 19]. Solid particles follow complex trajectories within a three-dimensional unsteady flow structure, where a peripheral downward vortex transforms into an inner upward vortex. Numerical analysis enables the identification of reverse flow zones, secondary flows, and ‘short-circuiting’ effects, where gas escapes into the vortex finder by bypassing the separation zone. These phenomena are difficult to capture using in-situ sensors inside an operating apparatus in physical experiments.
Optimization of the geometric parameters and operating modes of a cyclone based on numerical experiments allows testing hundreds of configurations without building costly prototypes, including sensor and data processing systems [2, 5, 8, 11, 19]. The pressure drop ∆p in a cyclone directly determines the power consumption for the separator operation, so simulation is an effective tool for optimizing economic costs, considering the high sensitivity of the ∆p value to the design. Mitigating abrasive wear under conditions of constant impacts of solid particles against the housing walls at high velocities is considered important. Simulation shows zones of high metal erosion, which allows reinforcing these areas or changing the cyclone geometry [20]. Conducting physical experiments is dangerous and expensive under extreme conditions of high temperatures and pressures, which is typical for the chemical industry. The computational model allows accounting for changes in gas viscosity and density at any temperatures and pressure.
A key factor in cyclone physics is turbulence and the unsteady nature of flows [2, 11, 19]. Their influence on separation efficiency manifests across various spatial and temporal scales. Turbulent velocity fluctuations translate particles chaotically. This produces a negative effect because if a particle is already near the wall, a random turbulent fluctuation can return it back into the central upward flow. In addition to turbulence, a source of strong unsteadiness is the vortex core precession, where the center of the vortex rope oscillates relative to the geometric axis of the apparatus [21]. These low-frequency velocity and pressure changes can lead to a number of consequences. Due to the displacement of the vortex axis, the centrifugal force field loses its axial symmetry. This dynamic factor makes the particle trajectories increasingly chaotic. The vortex core precession near the cyclone bottom creates a vacuum cleaner effect, pulling particles from the dust hopper back into the main flow. Finally, the oscillations of the vortex rope at the top, in the vicinity of the vortex finder inlet, make the boundary between the downward and upward flows unsteady. This creates conditions for the raw gas to break through from the outer zone directly into the vortex finder (the ‘short circuit’ effect), bypassing the separation zone in the cone. Thus, the physical processes listed above reinforce the instability of particle motion trajectories. This almost always negatively affects separation efficiency, hindering the deposition of fine fractions and promoting their entrainment into the central upward flow.
The aim of this work is to develop a method for processing numerical simulation results of gas dynamics in a cyclone separator to analyze the small-scale flow structure, primarily near the apparatus walls.
Materials and methods
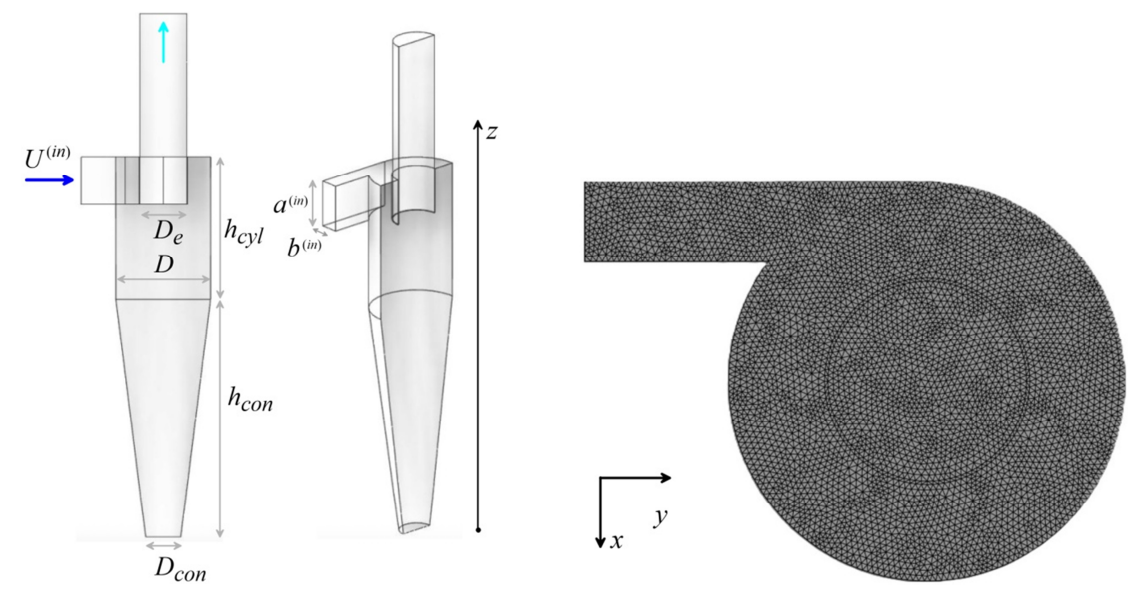
The classic separator is the Stairmand design, consisting of an upper cylindrical section and a lower cone (Fig. 1, a).
а b
Fig. 1. Geometry of the simulated cyclone (a), computational mesh (b):
U(in) – inlet velocity direction; De – vortex finder diameter; D – cylinder part diameter; Dcon – cone lower part diameter;
hcyl – cylinder section height; hcon – cone section height; a(in) – inlet tube height; b(in) – inlet tube width
Gas enters at a velocity of U(in) through a side inlet at the top of the cylinder, creating a highly swirling flow with an azimuthal velocity of
Constructing the velocity field in a cyclone in accordance with physical measurement data requires considering turbulence. Numerous results indicate the advantages of anisotropic turbulence models. For instance, the Reynolds Stress Model (RSM) and Large Eddy Simulation (LES), including their various modifications, are more appropriate compared to isotropic models (
At typical operating velocities of
 (1)
(1)
where  – filtered velocity resolving large-scale eddies; ∇ – nabla operator;
  – filtered pressure
The three spatial components in Cartesian or cylindrical coordinate systems are denoted by the indices (i, j, k) = (x, y, z) or (r, φ, z), respectively. Filtering is performed at the subgrid level and is governed by the dependence of  and the rotation through the vorticity tensor
The gas dynamics simulation is performed within a classic high-efficiency cyclone proposed by Norman Stairmand (see Fig. 1, a) with the following geometric parameters: D = 0.29 m, De = 0.145 m,
= 2.279.176. The flow-wall interaction is modeled using the Kader blending near-wall treatment. Unlike standard methods, this function provides highaccuracy profile matching in both the viscous sublayer and the logarithmic region of the boundary layer. This is achieved through a nonlinear hybrid approximation that guarantees the continuity of velocity and its derivatives during the transition from the viscous (linear) regime to fully
developed turbulent flow.
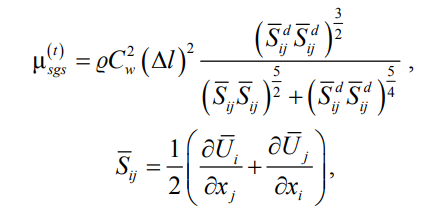
The subgrid-scale turbulent viscosity is modeled using the WALE approach [22]:
where Cw – WALE model constant;
This definition of  incorporates information about both shear strain and vorticity. A specific combination of these terms in the WALE model allows them to cancel out in solid-body rotation zones, which vanishes in zones of pure solid-body rotation. Repeated indices are summed over. The WALE model constant Cw determines the subgrid-scale dissipation intensity. Its default value is Cw = 0.325, providing the best agreement with the exact energy spectrum of decaying isotropic turbulence [22]. Varying this parameter within the 0.2-0.5 range allows for viscosity control. Specifically, selecting Cw < 0.325 enables the resolution of smaller eddies but requires a finer mesh to avoid numerical instability. Conversely, choosing Cw > 0.325 over-dampens the flow, reducing the inherent advantages of the LES approach. The overbar symbol denoting filtered velocity and pressure variables will be omitted hereafter.
At the cyclone inlet, a velocity of U(in) = 20 m/s is specified with a gas density of ϱ = 1.225 kg/m3 , which yields a Reynolds number of Re = 3.85 · 105. The inlet flow is characterized by a relative turbulence intensity of I = 0.037 and a hydraulic diameter of 0.082 m. The pipe length is sufficient to develop a velocity profile across the cross-section that is independent of the boundary conditions. The gas outflow from the vortex finder is governed by specifying the “Outflow” boundary condition in Fluent. This corresponds to free boundary conditions utilizing data extrapolation from adjacent grid cells. The average outlet velocity equals U(in) once a quasi-steady-state regime is established.
Parallel computations were performed on workstations equipped with Intel Xeon Gold 6248 (20 cores, 40 threads, 192 GB RAM) and Intel Xeon E5-2698
(20 cores, 40 threads, 512 GB RAM) processors.
Results and discussion
To analyze small-scale rapid fluctuations, it is proposed to consider velocity increments:
 (2)
(2)
by calculating velocity differences at a given grid node  at two close time instances tn and
  where
where 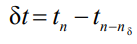 It should be emphasized that velocity increments characterize temporal velocity changes rather than the fluctuation values themselves.
A quasi-steady-state velocity distribution is established approximately 1 second after the start of the computation, which is due to the small dimensions of the cyclone. Fig. 2 shows the dynamics of tangential velocity increments in the near-wall layer within three cross-sections at different heights z = 0.225, 0.775, 1.075 m.
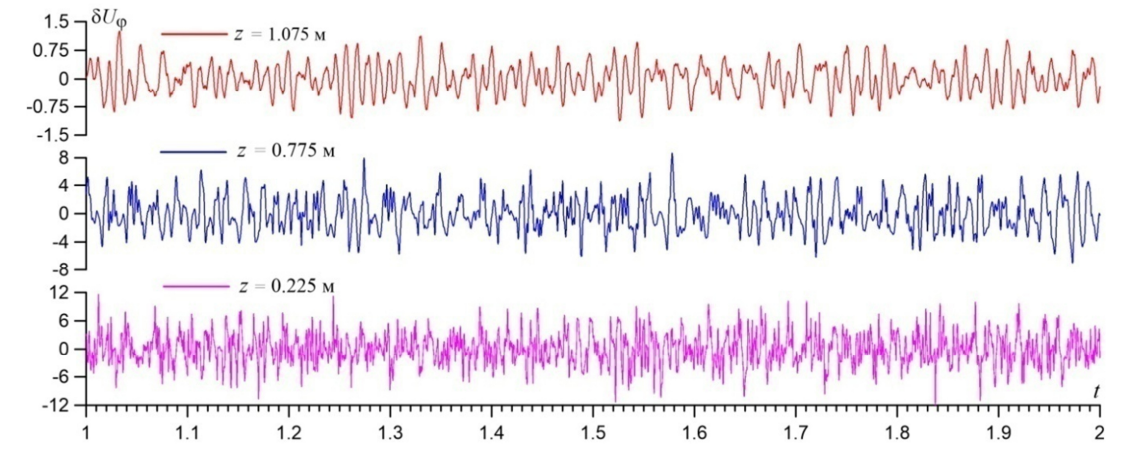
Fig. 2. Computational results for the velocity fluctuation dependence on time
in the LES model at three different points of the cyclone
The upper zone above the vortex finder inlet is the calmest. The time dependence δUφ(t) at a height of z =1.075 m exhibits a small amplitude within 1.3 m/s with a typical average period of 0.012 s, which yields a frequency of ω(1) = 520 rad/s. These oscillations reflect large-scale turbulent fluctuations, which is consistent with the estimated time for a single gas revolution,
The amplitude of the rotational velocity increment increases to 5-8 m/s below the vortex finder, in the transition zone from the cylindrical part to the conical section at a height of z = 0.775 m (see Fig. 1). Moreover, the nature of the fluctuations changes, with an increase in high-frequency components observed against the background of a typical fluctuation frequency of ω(2) = 630 rad/s. We attribute this to the enhanced generation of turbulent vortices in the near-wall region and the partial influence of the vortex core precession. In the lower part of the cone at the point z = 0.225 m, the aforementioned processes intensify. The amplitude of the velocity increment can reach 12 m/s, with high-frequency harmonics dominating the behavior of δUφ(t). This is due to the unsteady chaotic behavior of the vortex rope end, considering the proximity of the walls at the bottom of the cone.
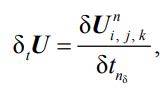
Dividing the velocity increment by the time interval
 (3)
(3)
where the choice of the increment
a single integration step are prone to strong random fluctuations (numerical noise). To eliminate these oscillations and extract large-scale dynamic trends, a numerical smoothing procedure over the time interval nδ = 5 is applied when calculating δtU. It is necessary to emphasize the physical meaning of equation (3). It characterizes the non-stationarity of the velocity field at a fixed grid point, which strictly corresponds to the Eulerian description of a continuous medium. Consequently, this local acceleration omits the convective transport term ∇•(U ⊗ U) from equation (1). Transition to the Lagrangian description requires the total (substantial) derivative: dU / dt = ∂U / ∂t + (U • ∇)U. This total derivative determines the true acceleration of an individual fluid volume or a solid dust particle by combining local non-stationarity with convective transport.
Utilizing the velocity increment (2) or the local acceleration operator δt (3) offers several advantages over analyzing absolute velocity values. First, the mean tangential velocity ⟨Uφ⟩ in a cyclone is high and can double the inlet velocity
Constructing the spatial distributions of δU(r, t) and δtU(r, t) requires interpolating data from an unstructured mesh (see Fig. 1) onto a regular grid in various cross-sectional planes. Let us first consider the numerical results obtained using the RSM, which provides the components of the Reynolds stress tensor
a vertical plane.
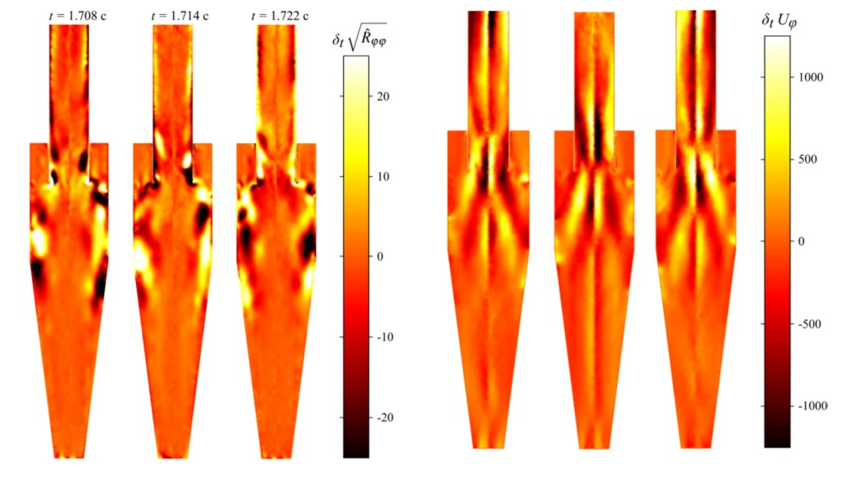
Fig. 3. Representative spatial distributions of the local acceleration based on based
on the tangential velocity component
calculated using the RSM turbulence model
Additionally, the
Fig. 4 displays the spatial distributions of the local accelerations
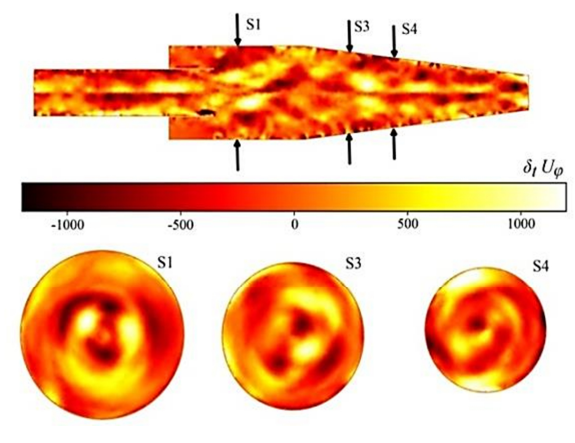
Fig. 4. Representative spatial distributions of the local
tangential gas acceleration calculated using the LES model
in the longitudinal (x, y = 0, z) planes
and across three transverse planes S1, S2, and S3
This approach clearly identifies the high-frequency non-stationary structures within the flow. Of particular interest are the near-wall formations. In the meridian plane, they appear as alternating chains of extrema along the apparatus walls. In the transverse cross-sections, these perturbations exhibit a characteristically thin, elongated shape. This topology aligns with modern concepts of near-wall turbulence generation mechanisms. Specifically, direct numerical simulations (DNS) demonstrate the elongation of vortex tubes and the formation of coherent streak structures oriented along the primary flow direction [23]. Crucially, the proposed analysis method does not merely capture static spatial inhomogeneities in the velocity field. Instead, it serves as a dynamic map reflecting the temporal evolution of these vortex structures.
For each time instant, the spatial distributions of the variables (2) and (3) are determined, from which the coordinates of the local spatial extrema are isolated. Specifically, these include the minima for negative perturbations and the maxima for positive perturbations of the local flow acceleration (Fig. 5).
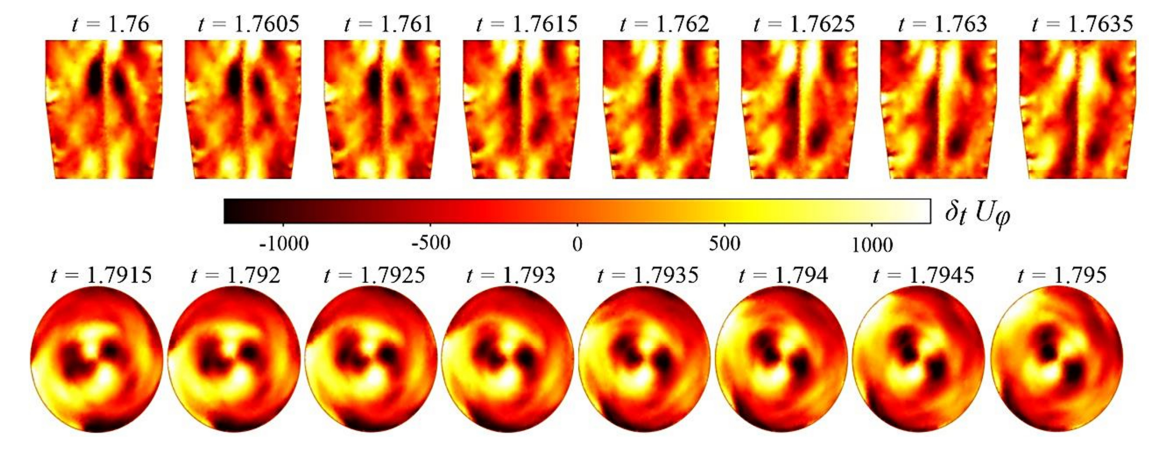
Fig. 5. Temporal evolution of the local tangential gas acceleration fields calculated via LES at consecutive time steps
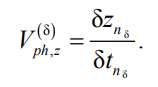
Calculating the vertical displacement 
 yields the phase velocity of the perturbation:
 (4)
(4)
The phase velocity estimation (4) is performed within a fixed vertical (meridional) cross-section of the cyclone.
The lifetime of streak structures 
0.002-0.02 s. Fig. 6 presents the calculated phase velocities along the z coordinate for a sample of streak structures obtained via LES.
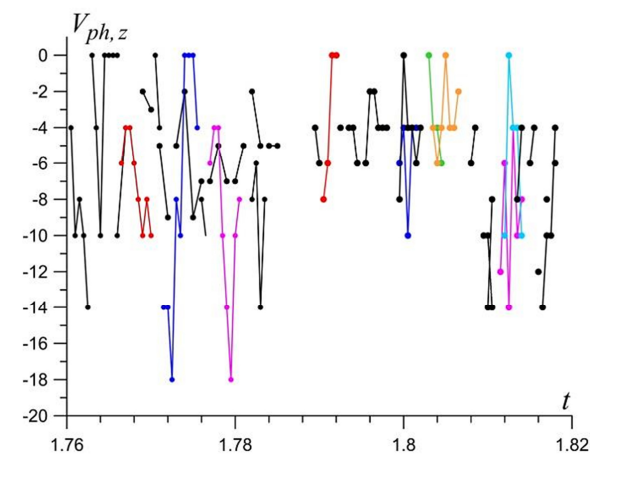
Fig. 6. Spatial distribution of the vertical phase velocity component belonging to small scale near wall gas perturbations
Each line tracks a single structure from its inception to disappearance. The lifetime observed in Fig. 6 is generally shorter than the DNS estimate.
This discrepancy stems from the specific perturbation tracking method applied in this work. Due to the high swirl velocity, the streak structure satisfies the condition . Consequently, the structure often exits the analyzed meridional plane before its actual destruction. The representative vertical phase velocities in Fig. 6 vary between 0 and 19 m/s. The proposed extremum isolation technique combined with a small gas dynamics integration step of ∆t = 0.0001 s yields a phase velocity error of approximately 1 m/s. This relative error of 5% reliably distinguishes slow structures from fast ones. It ensures the capture of true physical evolution rather than numerical noise. For a sample of streak structures over a time interval of 0.05 seconds, Fig. 7 presents the phase velocity distribution
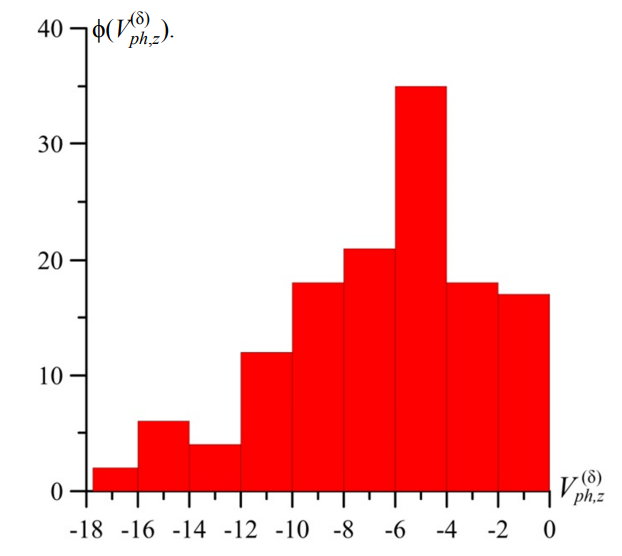
Fig. 7. Distribution of the vertical phase velocities of coherent streak structures within the numerical mode
The distribution exhibits a pronounced peak in the phase velocity range from 4 to 6 m/s. This interval closely matches the near wall axial gas velocity which varies from 4 to 9 m/s. Consequently, a significant portion of the structures undergoes transport by the primary flow due to advection. The established range of streak structure phase velocities from 0 to 19 m/s demonstrates high dynamic heterogeneity within the near wall layer. The achieved accuracy of 1 m/s in determining the perturbation phase velocity is sufficient for an accurate description of the interaction between fine particles and coherent flow structures. This sufficiency arises because the characteristic scale of velocity variation within the structures substantially exceeds the numerical error level. The vertical phase velocity component of certain streak structures can significantly exceed the mean local values of the vertical gas velocity. This phenomenon indicates that the vertical dynamics of perturbations in the near wall zone of the cyclone depend not only on drift by the primary flow but also on intense interaction with the high velocity rotating core. The elevated phase velocity of individual structures indicates the existence of mechanisms for rapid momentum transport along the conical walls of the apparatus. This conclusion is critically important for understanding and predicting the trajectories of fine particles.
The LES method explicitly resolves vortex structures with a minimum spatial scale of three to five cell sizes. Scales below two cell sizes are parameterized within the subgrid scale physics. Consequently, the question regarding the actual geometric dimensions of the detected near wall perturbations requires further investigation. This investigation necessitates calculations on substantially finer grids capable of resolving the boundary layer. The thickness of the viscous laminar sublayer in the analyzed cyclone ranges from 0.08 to 0.09 mm. Furthermore, a transition zone is located between approximately 0.09 and 0.5 mm from the wall where turbulent vortices begin to generate. Above 0.5 mm and up to 30 mm lies a fully turbulent logarithmic layer whose dynamics are governed by the solid boundary effect. Considering the relationship between the cell size and the total cell count, high quality resolution of vortex structures within the boundary layer requires a near wall grid spacing of
0.1 mm. Even with local mesh refinement techniques, this requirement demands approximately two hundred million cells. Such a computational scale shifts these models toward DNS. The application of DNS methods for modeling cyclone separators at high Reynolds numbers is limited by extreme computational complexity. This limitation stems from the power law dependence of the total cell number and the integration time step on the Reynolds number. Therefore, the proposed analysis of velocity increments and local accelerations is of significant interest. It provides an opportunity to evaluate the properties of coherent streak structures and vortex generation mechanisms within the cyclone boundary layer using LES models with a relatively moderate cell count.
Conclusion
To perform a comprehensive analysis of spatial perturbations within the cyclone separator chamber, a method based on evaluating gas velocity increments δU and local accelerations δtU via LES modeling was developed and proposed according to equations (2) and (3). This approach identifies coherent near wall streak structures despite the subgrid mechanism of their generation in numerical cyclone models using moderate computational meshes of only a few million cells. The calculated phase velocities and lifetimes of these coherent structures demonstrate satisfactory agreement with fundamental data from direct numerical simulations DNS. The proposed method is also highly effective for investigating the non stationary dynamics of the precessing vortex core. It is established that the local gas accelerations can reach extreme values of up to 100 g and above within both the axial zone of the vortex core and the near wall region of the cyclone. The achieved accuracy of 1 m/s in determining the phase velocity is sufficient for an accurate description of the interaction between fine particles and coherent flow structures.
High frequency near wall gas pulsations induce the detachment of the solid phase from its calculated trajectories. Due to their specific inertia, dust particles adapt to smooth and slow variations of the carrier flow, thereby maintaining their motion along the apparatus wall. Conversely, rapid pulsations exert an impulsive dynamic impact on the dispersed phase. When the characteristic duration of a pulsation is comparable to the dynamic relaxation time of a solid particle, the particle is instantaneously ejected from the boundary layer back into the central upward flow. This phenomenon represents the primary mechanism of secondary dust re-entrainment. This mixing induces continuous suspension of the dispersed layer near the conical walls of the apparatus. Consequently, it prevents the deposition of fine particle fractions into the dust hopper, thereby reducing the overall separation efficiency.
Precession of the vortex core contributes significantly to the non stationary behavior of δU and δtU. High frequency pulsations induce chaotic bending and spatial oscillation of the vortex rope. Under a stable vortex rope configuration, the separation process follows the classical mechanism where the dispersed phase undergoes centrifugal transport toward the walls followed by slow deposition. Conversely, rapid spatial displacements of the vortex axis alter the local pressure field. Consequently, the low pressure zone developing at the center intensely entrains fine particles from the flow periphery. This phenomenon causes a sharp degradation in fractional separation efficiency, particularly for fine dust fractions. Finally, the short circuiting of contaminated gas beneath the vortex finder is also functionally related to rapid velocity and pressure pulsations generated directly below the exhaust pipe cut. These perturbations induce the formation of short lived gas transport channels. Through these non stationary channels, solid particles bypass the primary separation zone of the apparatus and penetrate directly into the vortex finder.
Turbulence models belonging to the RSM family fundamentally fail to describe the true non stationary dynamics of near wall vortex structures. The observed fifty fold excess of the mean velocity increments δtU over the increments of turbulence characteristics calculated via the Reynolds stress tensor is explained by the dominance of macroscopic non stationarity induced by the vortex core precession. Within the RSM framework, the mean velocity field dynamically adjusts to the spatial displacement of the vortex axis in zones of high spatial gradients. Conversely, the turbulent stress field exhibits high inertia and a more smoothed spatial distribution. It is established that the RSM approach systematically underestimates the dynamics of turbulent characteristics, demonstrating stress increments nearly two orders of magnitude smaller than those of the mean velocity. This phenomenon proves the inapplicability of the RANS family approaches for analyzing rapid local processes inside cyclone separators. Consequently, it mathematically justifies the necessity of utilizing LES models for accurate prediction of the instantaneous dynamic impacts exerted by the carrier flow on the dispersed phase.
1. Фадин Ю. М., Богданов В. С., Юрьева М. В., Вечканов А. В. Возвратно-поточные циклоны. Истоки возникновения и направления совершенствования // Вестн. БГТУ им. В. Г. Шухова. 2017. № 5. С. 104–109.
2. Ayl E., Kocak E. A comprehensive review of cyclone separator technology // The Canadian Journal of Chemical Engineering. 2024. V. 103. N. 6. P. 2751–2789.
3. Rivera-Garcia M. O., Reyna M. A., Camarillo-Ramos M. A., Reyna-Vargas M. A., Avitia R. L., Cuevas Gonzalez D., Osornio Vargas A. R. Cyclone Separator for Air Particulate Matter Personal Monitoring: A Patent Review // Atmos-phere. 2023. V. 14. N. 4. Id. 624.
4. Топталов В. С., Чесноков Ю. Г., Мешалкин В. П., Кулов Н. Н., Флисюк О. М., Марцулевич Н. А., Лихачев И. Г. Оценка эффективности разделения пылегазовых потоков в прямоточных циклонах // Теоретические основы химической технологии. 2023. Т. 57. № 4. С. 363–370.
5. Vivek R., Venkatesh S., Manoj V., Kumar M., Mohanasundaram. A brief review on improving materials particulates using cyclone separator by geometrical and turbulence factors // Materials Today: Proceedings. 2022. V. 69. N. 3. P. 1076–1079.
6. Азаров В. Н., Азаров Д. В. Пылеуловители со встречными закрученными потоками. Волгоград: Изд-во ВолгГТУ, 2020. 140 с.
7. Sakharova A. A., Sorokin A. Yu., Azarov D. V., Lu-pinogin V. V. The effectiveness of the dust particles of the flask in the apparatus of counter-swirling flows // IOP Conference Series: Materials Science and Engineering. 2021. V. 1083. Id. 012099.
8. He W., Yang J., Sun G. Inserting an Additional Vortex Finder to Improve the Performance of Cyclones in Series // Separations. 2025. V. 12. N. 1. Id. 60.
9. Гольцов А. Б., Логачев К. И., Тирон О. В. Вихревая вентиляция. Закрученные рециркуляционные, отрывные пылевоздушные течения. Белгород: Изд-во БГТУ, 2025. 349 с.
10. Катин В. Д., Ахтямов М. Х., Долгов Р. В. Модернизация и разработка новых эффективных золо- и пылеуловителей для защиты среды обитания человека. М.: Спутник+, 2015. 116 с.
11. Савин Е. С., Хоперсков А. В. Обзор численных моделей пылеуловителей циклонного типа // Математическая физика и компьютерное моделирование. 2025. Т. 28. № 4. С. 54–106.
12. Васильев А. В. Обзор патентов и технических решений по снижению негативного воздействия выбросов в воздушную среду в условиях урбанизированных территорий // Изв. Самар. науч. центра Рос. акад. наук. 2025. Т. 27. № 3-2. С. 440–451.
13. Полиефтова А. П., Седляров О. И., Отрубянников Е. В. Численное исследование эффективности циклонов, применяемых в аппаратах послойного синтеза методом селективного лазерного сплавления // Промышленные процессы и технологии. 2025. Т. 5. № 3. С. 82–91.
14. Красовицкий Ю. В., Николаев В. И., Пигловский Н. В., Федорова М. Н. Конструкции, расчет и аэродинамическая оптимизация вихревых пылеуловителей в производстве строительных материалов // Строительные материалы. 2010. № 5. С. 84–87.
15. Злочевский В. Л., Мухопад К. А. Аэродинамическое сопротивление винтового канала в циклоне сепараторе // Техника и технология пищевых производств. 2017. Т. 46. № 3. С. 102–107.
16. Meskhi B. Ch., Gumenyuk A. S., Dzhedirov D. A., Bedoidze M. V. Modeling Dust Disperse Composition when Designing Aspiration Systems of Milling Machines // Occupational Safety in Industry. 2025. N. 10. P. 87–93.
17. Шартдинов А. Ш., Квятковская А. С., Эпимахов Н. Л., Силантьева Л. Я. Применение синтез-газа для производства альтернативных источников энергии // Современные наукоемкие технологии. 2021. № 3. С. 106–111.
18. Петров Д. Н., Чистякова Т. Б. Система автоматизированного проектирования и прототипирования участков синтеза углеродных нанокластерных структур // Вестн. Астрахан. гос. техн. ун-та. Сер.: Управление, вычислительная техника и информатика. 2021. № 3. С. 16–27.
19. Chen J., Chen Y., Zhang L., Zhao B., Li Y. Numerical Simulation of a Novel Secondary Separation Cyclone // Processes. 2025. V. 13. N. 6. Id. 1874.
20. Guo M., Xia G., Guo P., Manickam S., Yoon J. Y., Sun X. Insights into local wall erosion characteristics and prevention measures for cyclone separators // International Journal of Fluid Engineering. 2024. V. 1. N. 4. Id. 040601.
21. Savin E. S., Khoperskov A. V. Comparative Analysis of Turbulent Models for Gas Flow Dynamics in Cyclone Separators // Technologies. 2026. V. 14. N. 5. Id.282.
22. Nicoud F., Ducros F. Subgrid-Scale Stress Modelling Based on the Square of the Velocity Gradient Tensor // Flow, Turbulence and Combustion. 1999. V. 62. P. 183–200.
23. Lozano-Duran A., Jimenez J. Time-resolved evolu-tion of coherent structures in turbulent channels: characterization of eddies and cascades // Journal of Fluid Mechanics. 2014. V. 759. P. 432–471.